Office - Reporting - Dashboard
Table of Contents
Overview
Dashboards will provide instant visibility to commonly used information in one view. Users can customize their dashboards by
creating their own report criteria and selecting their specific reports to view in the dashboard. Many Dashboards work with
Interactive reports so we will cover Interactive Report functionality in this document as well.
Required Permissions
Reporting
Dashboards Module
Dashboards: in CMA on the left menu we have added several new dashboards for key modules
Select Dashboards.
Select the desired Dashboard.
Example of a Dashboard Layout:
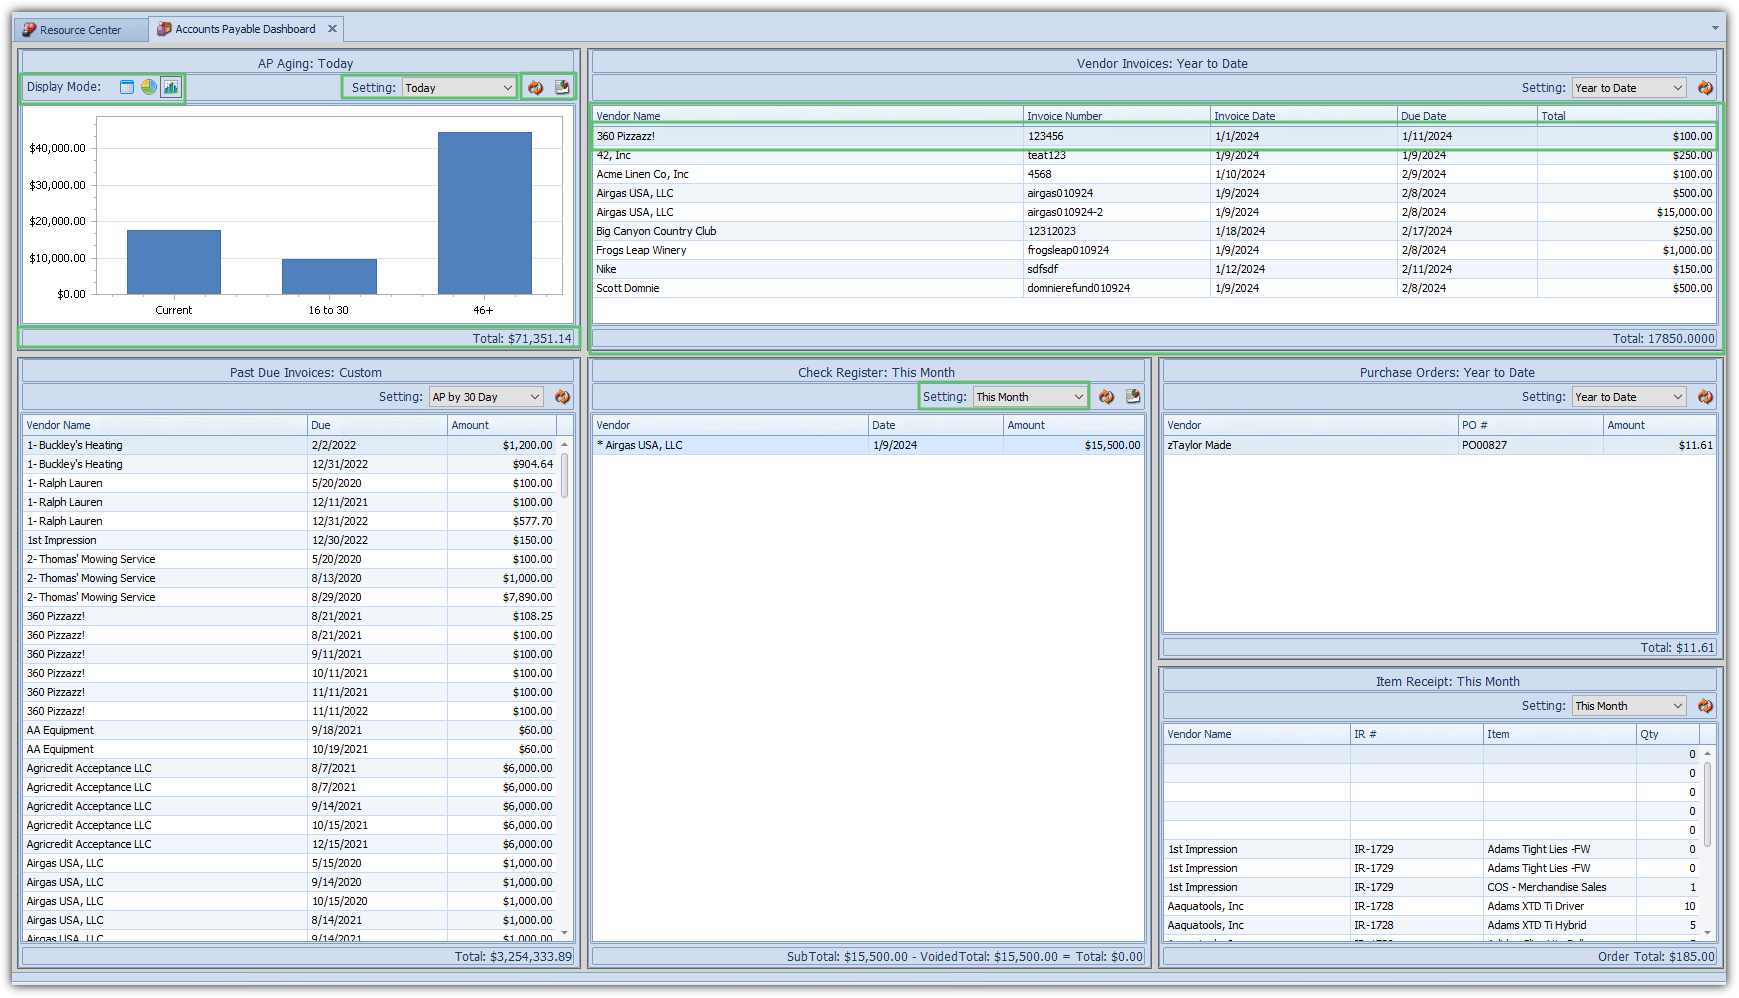
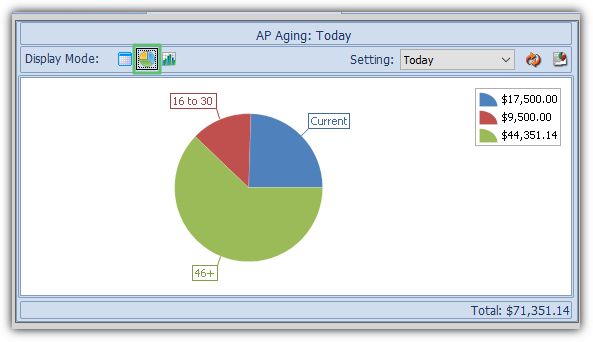
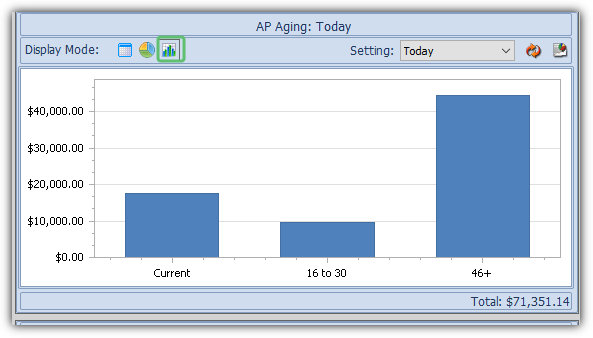
Display Mode:
Display Modes: In some dashboards you will see Display Mode icons. When these icons are available you have a choice on how you want the information to display. Not all dashboards will have display options.
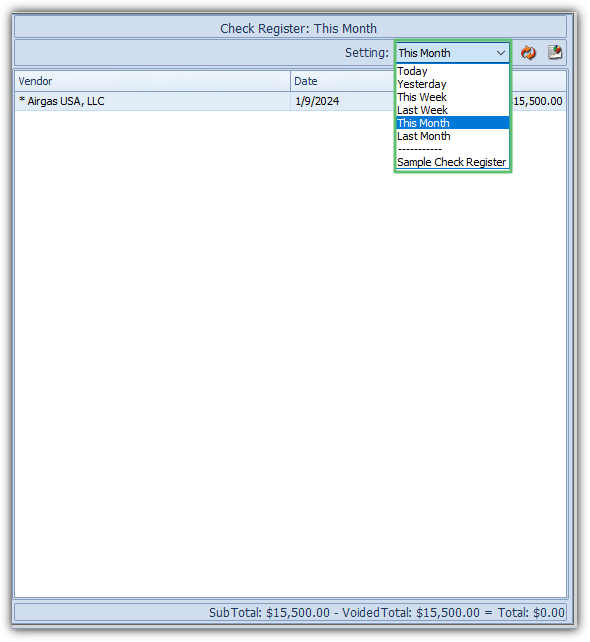
Settings
Settings will list the available reports
Click the down arrow
Highlight the report your want displayed
Notes:
The reports listed above the dotted line are system defined reports. The reports listed below the dotted
line are user defined reportsThe last report you displayed will become your default dashboard report. You can change the default at
any time by selecting a different report
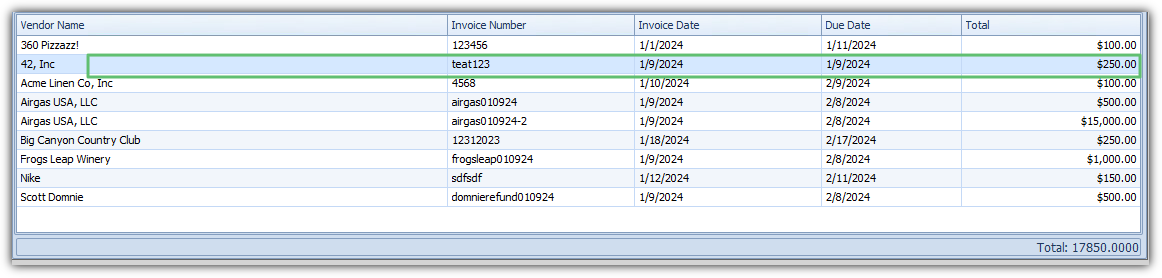
Column Headings, Content, and Totals
Column Headings: will give a description of the content displayed in that column. You can sort by any column by clicking
on the heading description
Content: you can double click on any line to drill down to the transaction detail
Dashboard Totals: at the bottom of each dashboard will list the totals
Interactive Report Icon: will take you to the interactive report where you can change the report criteria’s or create your own
report. Many dashboards are not generated by a report and therefore you may not see this icon available for all dashboards
Refresh Icon: will update the data with any new information pertaining to the displayed dashboard
Best Practices
FAQs
