Versions Compared
Key
- This line was added.
- This line was removed.
- Formatting was changed.
Table of Contents
| Table of Contents | ||||||
|---|---|---|---|---|---|---|
|
Overview
This guide will review the most versatile tool for gauging member interaction, the Usage Stats.
Required Permissions
Admins
Editors
Accessing the Tools
Follow the steps below depending on your access role.
Admins: Hover over Admin bar in the left hand corner of the screen, select Site Statistics.
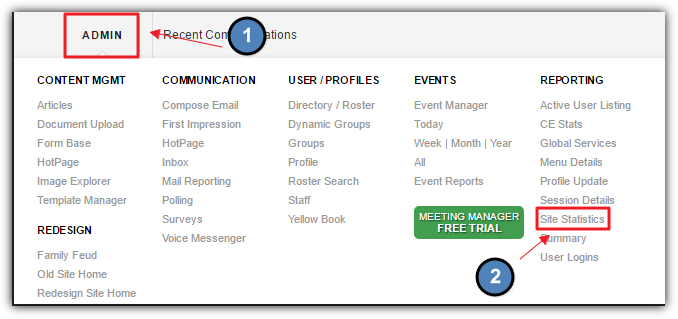
Editors: Hover over Admin in the main navigation, select Site Activity, and then Site Statistics.
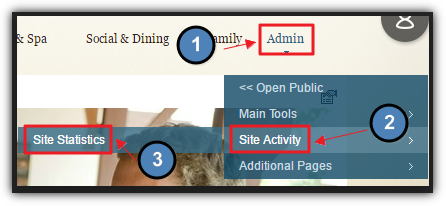
The Site Statistics Interface will launch. Click on the Usage Stats tab.
Usage Stats
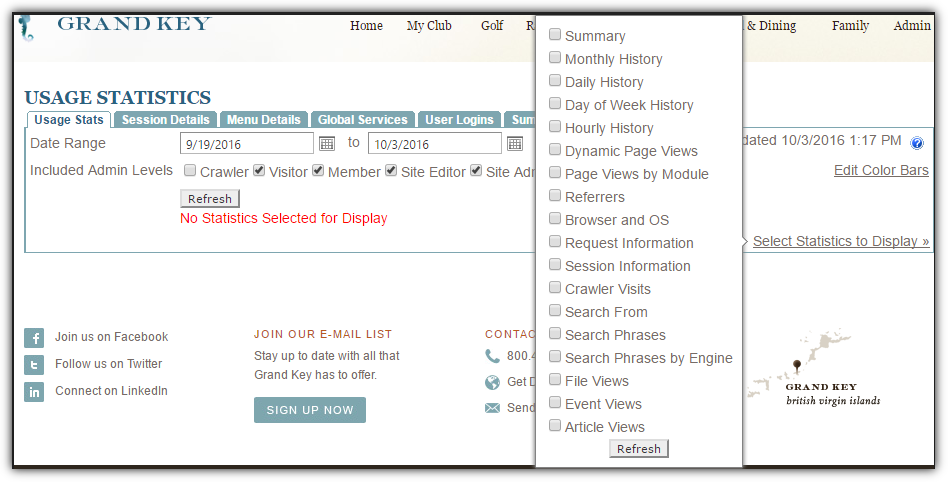
Date Range: using the date picker, adjust the date range in order to capture data from a certain time frame. It is best to only review a few months at a time, as the more months are reviewed the longer it can take to pull data.
Included Admin Levels: allows to view stats for visitors, members, admins, and editors. In most cases, uncheck admins and editors as this may skew the numbers of meaningful data.
Statistics: all stats that can be displayed under Usage Stats are enabled or disabled here. Hover over the Select Statistics to Display button. Use the checkboxes to determine which stats to review. You may select one or multiple statistics to review. Once a stat is selected via the checkbox, click refresh to capture data in the interface.
Summary: provides an overview of several key statistics used for general traffic patterns.
Unique IPs: roughly the number of unique visitors. Counts visits from a single computer as 1 unique visit.
Number of Sessions: number of overall visits. This will count if the user lands on the site and then exits. Returning users will count as a separate session.
Unique Page Hits: shows the number of unique hits. Does not count page refreshes.
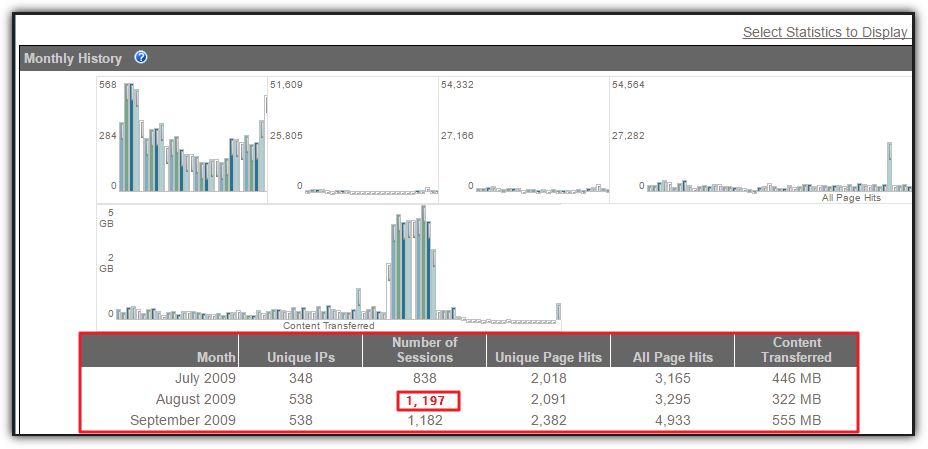
Monthly History: gives summary grouped by month. Here we disregard the date range. This allows you to compare month to month stats, like an email campaign. The first graph will show the Monthly history. Below this is a table of raw figures that will show the top number in red.
Daily History: shows stats for each day in a range. This can be used for more precise details about traffic. Table of raw figures will show the top number in red.
Day of the Week History: groups stats by day of the week. This will show which days of the week are most popular for traffic. This data is very useful in deciding what days of the week to release campaigns or generate new content. Along with Day of the Week History, we can view Hourly History in tandem to pinpoint not only which day is most popular but which hour of the day is most popular. Combined, these two stats reveal the best day of the week and time of day to market towards your membership.
Dynamic Page Views: groups the unique page hits and all page hits by page. This will show the most popular pages for a selected date range. Useful when looking to cross market, so ensure that the marketing pieces are placed on the most popular pages.
Page Views by Module: groups page views by modules on the website. Modules are the Directory, Calendars, Articles, and Statements. This is not used as frequently for tracking activity.
Referrers: shows stats for visitors who arrived from another location.
Browser & OS: information about what software and devices are being used to access the site.
Request Information, Session Information, and Crawler Visits: very specific, infrequent uses.
Search Statistics: shows comprehensive search stats based on what words people are using to find the website.
Search From: shows visitors grouped by search engine.
Search Phrases: lists tops search phrases that lead visitors to the site.
Search Phrases by Engine: shows top search phrases by the search engine.
File Views: shows stats for the files in the document upload. If documents on the site have too few views, then additional marketing efforts can be made based on this stat.
Best Practices
The most important statistics are the Usage Stats, where the majority of information on amount of traffic and when such traffic occurred can be found. This information can help in determining where to post new content and when to market this content.
When reviewing data in a date range, only choose a few months at a time. If a large number of months are reviewed at once, it can take the data considerable time to load. Reviewing large amounts of data at once can also be hard to read. Instead, review statistics frequently to keep up to date with the trends on the site.
Increase your target marketing by posting content on popular days and times so that more traffic is likely to see this. To do this, review the Hourly and Day of the Week History. Take an extra step and review Menu Details to find the most visited pages on the site, so that the marketing material can be placed on those pages.
Do you have important information that has low hits? Try moving it into an email marketing campaign, or moving it to another popular page.
FAQs
Q. There are a lot of Site Statistics - where should I start?
A. Begin with with the Usage stats tab, as this is where the majority of the information regarding your site’s traffic patterns can be found.
