Versions Compared
Key
- This line was added.
- This line was removed.
- Formatting was changed.
Table of Contents
| Table of Contents | ||||||
|---|---|---|---|---|---|---|
|
Overview
https://clubessentialholdings.sharepoint.com/:w:/r/sites/educationteam/_layouts/15/Doc.aspx?action=edit&sourcedoc=%7B099e924a-d5ce-44b9-8066-fb63c67bd68d%7D&wdOrigin=TEAMS-WEB.teamsSdk.openFilePreview&wdExp=TEAMS-CONTROL&web=1As the Spa/Professional Services Admin, you will review the Club Intelligence Spa and Professional Services to gain valuable insights into your area's trends and forecasts.
Each dashboard you access will be composed of various widgets. Some can be modified via filters but also will have options within the widget to drill down for more information and Data. For more information on filtering widgets, please refer to the guides:
Required Permissions
Club Intelligence Admin
Accessing the Tool
Go to Admin Bar.
Select Club Intelligence.
Select the Spa and Professional Dashboard
Provider Dashboard Widgets
Within the Spa and Professional Services Dashboard, you will see the following widgets that will display filterable data forecasting and trends.
The first three widgets all reference Reservations and their corresponding data.
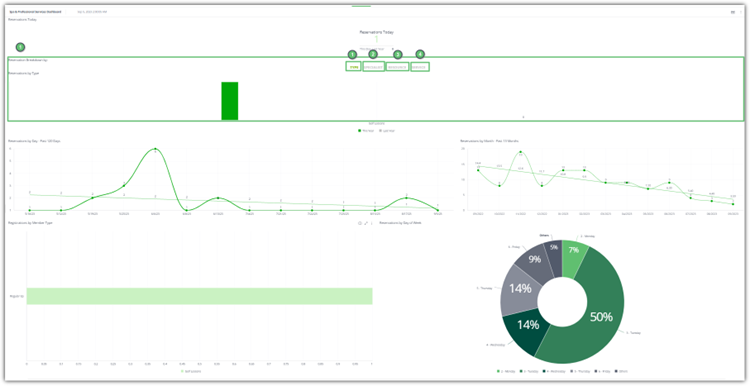
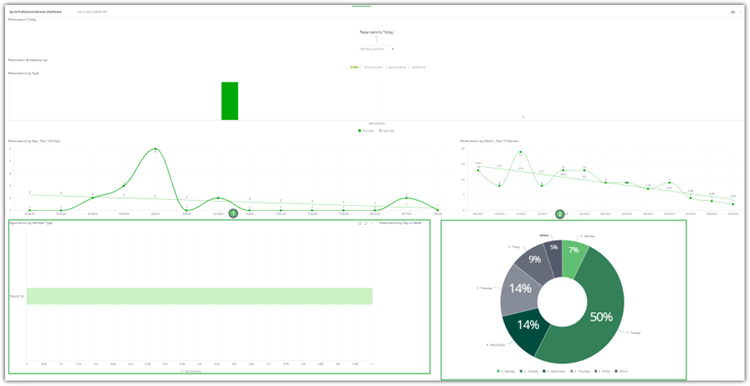
Reservations Today -The first widget shows the upcoming reservations for the day compared to the same day last year.
Reservation Breakdown By - The second widget allows the professional to choose how they want to see the data within the third widget. Select one of the following data types to view the data:
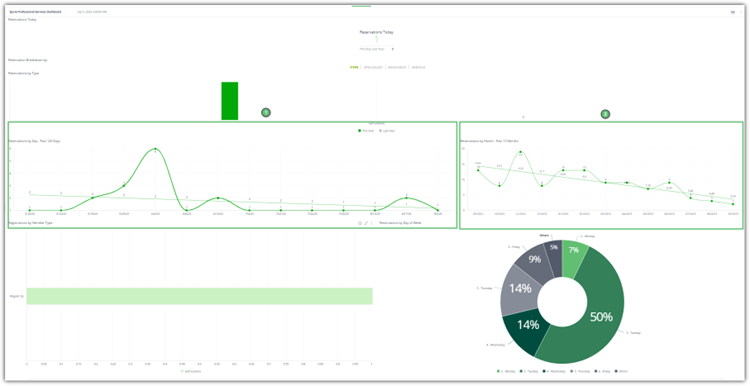
Type – Click on the Type view. You can then hover over the reservation type for additional information.
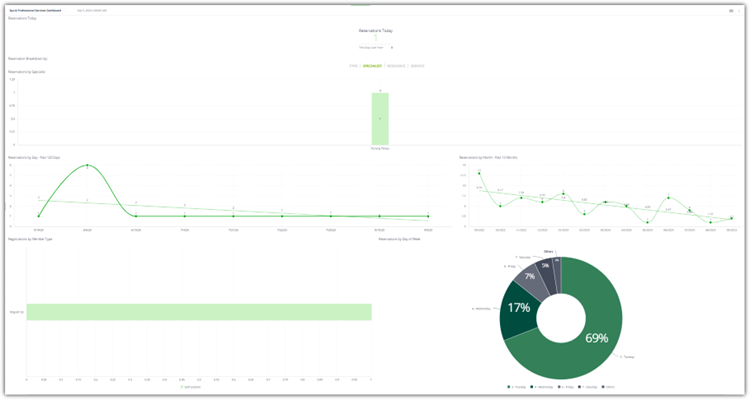
Specialist – Click on the Specialist view. You can then hover over the specialist's name to get a drilldown on that specialist’s current reservations.
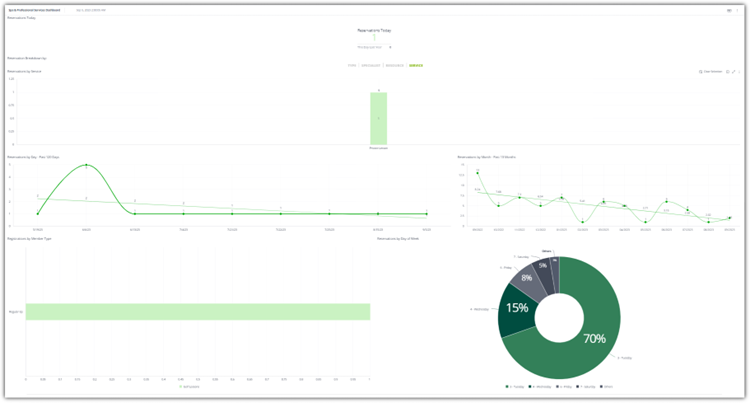
Resource – Click on the Resource view. You can then hover over the resource for additional information.
Service – Click on the Service view. You can then hover over the service type for additional information.
Please Note: Clicking on any one of the Bars in the graph will change the next series of widgets to follow data for that specific data point. I.e. If you were to choose SPECIALISTS and then click on a specialist, the Reservations by Day and By Month will apply a filter to reflect their reservations. You can clear the filter using the refresh icon located under the Filters tab.
Reservations by Month and Day
Next, we see the following widgets:
Reservations by Day (Past 120 Days) – A line graph showing the number of reservations by day. Hovering over a data point will allow the user to see additional information about the number of reservations for that day.
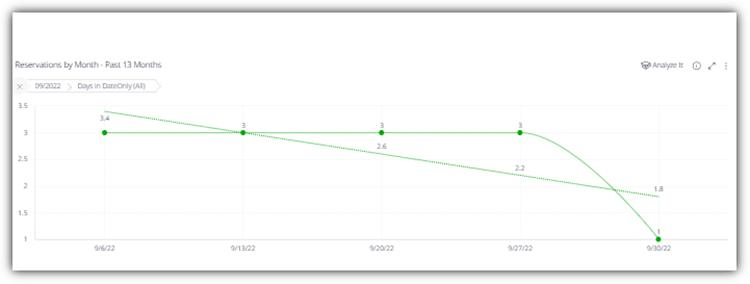
Reservations by Month (Past 13 Months) – A line graph showing the number of reservations by month. Hovering over a data point will allow the user to see additional information about the number of reservations for that Month.
Reservations by Member Type and Day of the Week
The last set of widgets we see is the following:
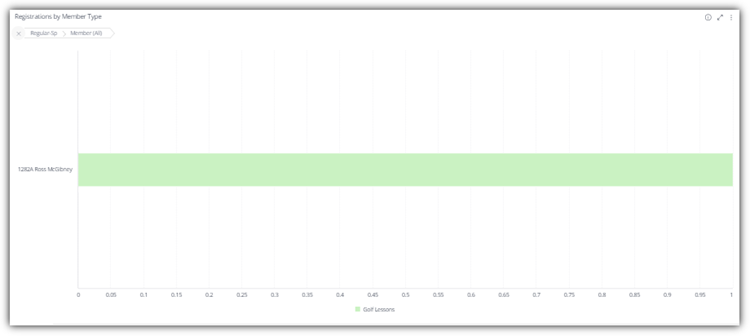
Registrations by Member Type – Shows how many members are booking reservations based on their membership type in a bar graph format. You cannot filter the graph; you can click on a data point (Member Type) to then drill down into Member.
Reservations by Day of the Week – Shows a pie chart with the exact percentage of reservations that take place on a given day of the week. Hover over the day of the week to see a drilldown of the exact number of reservations that occurred on that day.
Best Practices
FAQs
