Dashboards will provide instant visibility to commonly used information in one view. Users can customize their dashboards by
creating their own report criteria and selecting their specific reports to view in the dashboard. Many Dashboards work with
Interactive reports so we will cover Interactive Report functionality in this document as well.
Interactive Reports give you the ability to filter, sort, and group the data using criteria. The available criteria are specific to
the information the report contains. The report functions give you the ability to customize date settings, save criteria settings,
delete saved reports, and schedule an email delivery. In this section, you will learn how to use the criteria and report
functionality.
Video
Club Intelligence Module
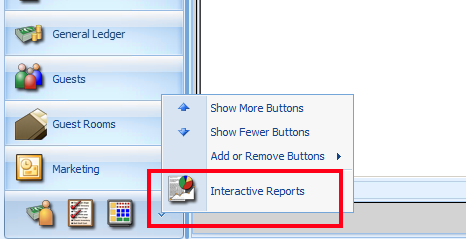
Club Intelligence: in CMA on the left menu we have added several new dashboards for key modules
Select Club Intelligence > select the desired Dashboard
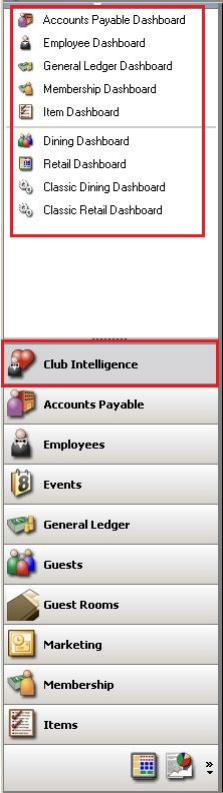
Example of a Dashboard Layout:

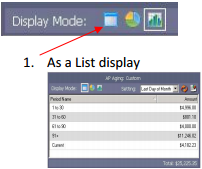
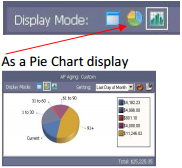
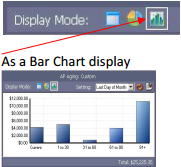
Display Mode:
Display Modes: In some dashboards you will see Display Mode icons. When these icons are available you have a
choice on how you want the information to display. Not all dashboards will have display options.
Settings
Settings will list the available reports
- Click the down arrow
- Highlight the report your want displayed
Notes:
The reports listed above the dotted line are system defined reports. The reports listed below the dotted
line are user defined reportsThe last report you displayed will become your default dashboard report. You can change the default at
any time by selecting a different report
Column Headings, Content, and Totals
Column Headings: will give a description of the content displayed in that column. You can sort by any column by clicking
on the heading description
Content you can double click on any line to drill down to the transaction detail
Dashboard Totals at the bottom of each dashboard will list the totals

Interactive Report Icon will take you to the interactive report where you can change the report criteria’s or create your own
report. Many dashboards are not generated by a report and therefore you may not see this icon available for all dashboards

Refresh Icon will update the data with any new information pertaining to the displayed dashboard

Interactive Reports
Interactive Reports gives you the ability to filter, sort, and group the data using criteria’s. The available criteria are
specific to the information the report contains. The report functions give you the ability to customize date settings,
save criteria settings, delete saved reports, and schedule an email delivery. In this section you will learn how to use
the criteria’s and report functionality.
- Click on the Interactive Report Icon
- Notes:
If you are clicking on the icon from the dashboard it will take you directly to the report; go to step 3
- If you are clicking the icon from the CMA options proceed with step 2
- Notes:
At the top left will display the report options by module > click the + sign to expand and list the available
reports > click on the report you want
The following instructions will explain the standard Interactive reporting functionality: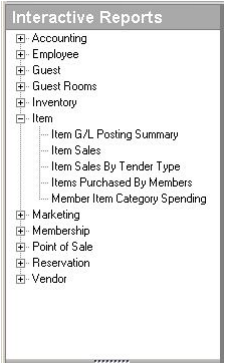
- Criteria options are what make the Interactive Reporting tool powerful; the drop down selection makes it
simple to select the information you want and remove the information you don’t want. You will learn there are
other powerful features with the Interactive Reporting but before you can truly take advantage of the SQL
reporting tool you will have to understand how to use the criteria options to generate the information you
desire. Every report will have various criteria to choose from (some more than others). The best practice is to
take the time to look at each criteria field before running the report. Remember that once you have selected
all the criteria settings you can save the report so you never have to go through the process again unless you
wish to change the report in some way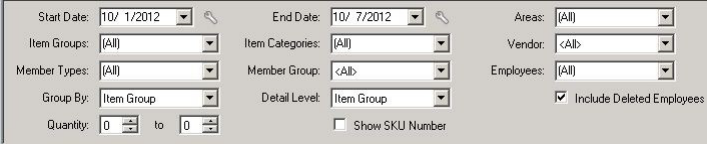
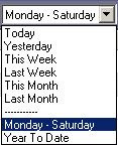
At the right side of each criteria option is a down arrow. Click on the down arrow to see the
available choices. Some criteria options may be multi-select and some will be single-select.Some reports will have a Start Date and End Date and others will have an As of Date. The reports that
have a start/end date have the ability to customize the date settings.Detail Level will determine how much drill down detail to include (Member or Family detail, Item or
Item group, etc…)- Group By will determine how the report is organized to subtotal the detail
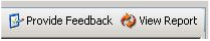
- Once all criteria options have been set > Click View Report (far right corner of screen)
- Note:
The Provide Feedback is a way for you to communicate with our developers; to provide suggestions and
ask for an enhancement to the displayed report. This is not a support ticket
- Note:
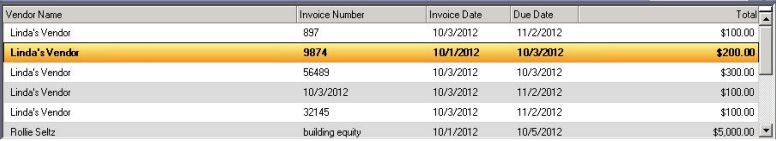
- The detail will be displayed at the bottom of the report screen
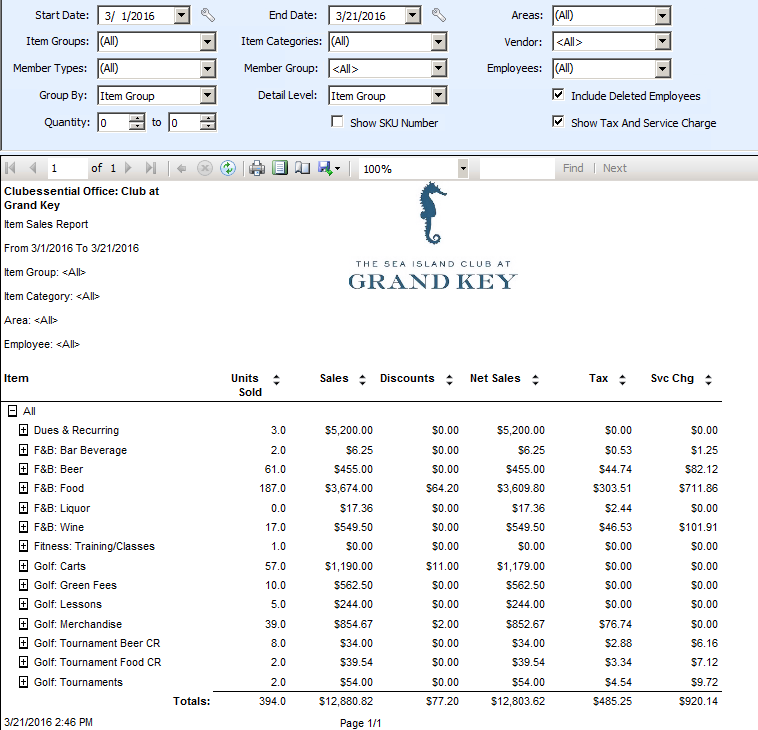
- If you see Up/Down Arrows at the end of the column description you can sort the data by clicking on either the
Up or Down arrow and results will sort first in ascending then descending order with subsequent click:
Saving your Criteria Settings
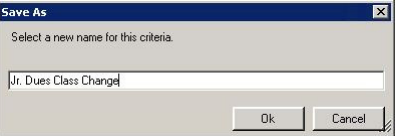
- Click Save Current Settings

- The system will prompt for a Name
- Saved reports can be accessed by > click the down arrow on Report Settings
- Notes:
- The saved reports are user specific. Each user will see only the report settings they saved under their user login
- If you receive this message when saving it is because the report highlighted in Report Settings is a saved report;
if you want to create a new report select No. If you want to change the saved report select Yes to override the
report settings.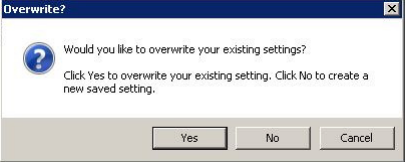
- Notes:
Schedule Email Delivery
- Click on Setup Email Delivery
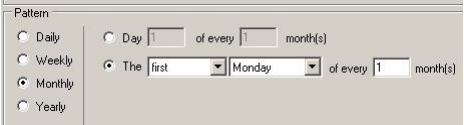
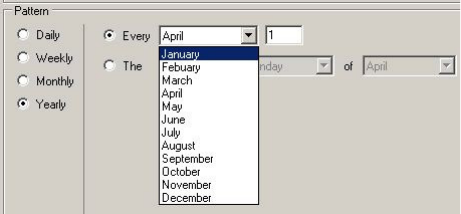
- Scheduling tab > set the Start Date and Time to begin delivery
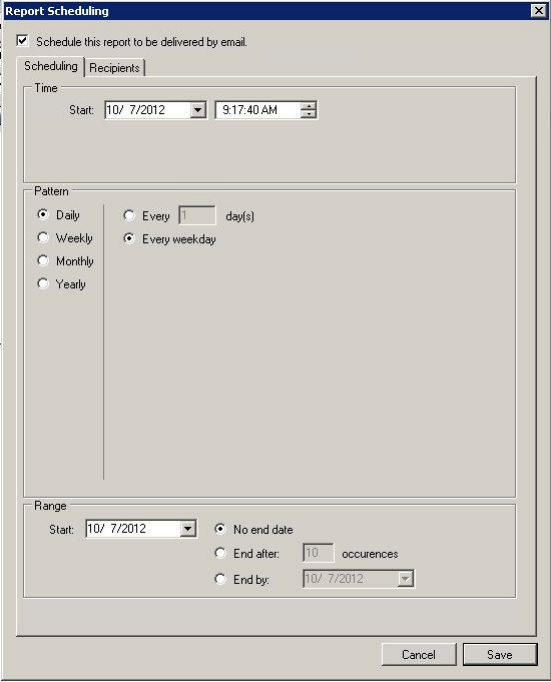
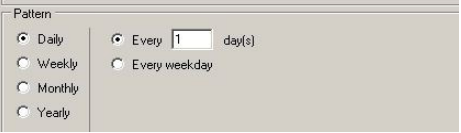
- Select one of the Patterns to use for scheduling > on the right of the Patterns are the scheduling options
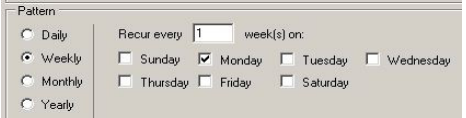
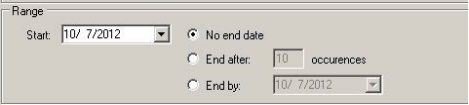
Note:
If the schedule is to End at some point use the End After or End By to set the parameter
Select Recipients tab
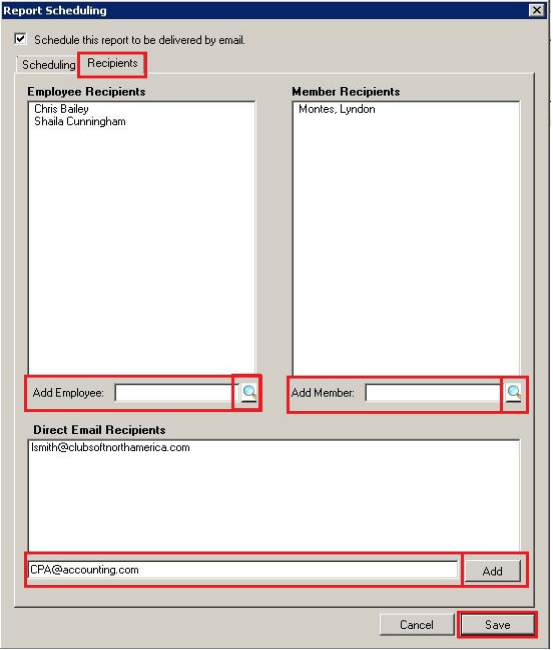
- Click one or all the Search Icons to find a recipient

- Notes:
- Add Employee to send scheduled report to employees on file with an email address
- Add Member to send scheduled report to members on file with an email address
- Direct Email Recipients to manually enter the email addresses if recipient is not on file > click Add
- When done > click Save
- Notes:
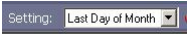
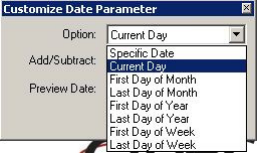
Customize Date Parameter
- Click on the wrench icon at the end of the Start Date or End Date

- Select the Option
Set Add /Subtract (if applies)
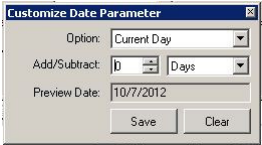
- Save when done
- Notes:
- If a Customized Date Parameter has been set on a report date field it will be grayed out and the wrench icon
will turn to a Green Ball. You can always clear or reset the parameters by clicking on the green ball and
selecting Clear
Here's an example of when you would use the Add/Subtract function: let’s say you want the previous 10 days activity; you
would set the Option to Current Day and Subtract 10 Days.
- If a Customized Date Parameter has been set on a report date field it will be grayed out and the wrench icon
- Notes:
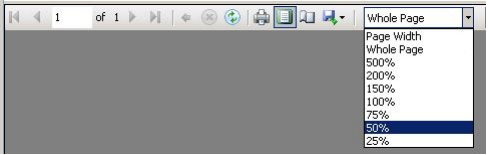
Report Tool Bar
Below the criteria settings is the Report Tool Bar

Next & Previous Page If the report contains more than one page you can use the arrows to advance forward or
move backward
Find is a great feature available in all Interactive reports and Batches. Use the Find function if you have a long
report and want to find a specific amount or name.Enter the search criteria in the blank box > click Find it will stop at the first record that meets the criteria, if this
is not the record you want > click Next continue until it finds the record or it completes the search
- Zoom will increase of decrease the screen display
Export options you can export reports to Excel, PDF, or WordPad (WordPad does not support all formats in the
document content and might be missing or display improperly)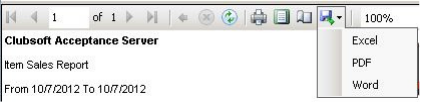
Page Preview and Page Setup: the icon to the right is the Page Setup where you can change the orientation and
margins. The icon to the left allows you to Preview the report
Report Tabs
- Report Tabs are found at the top of the report screen: each time you view a report the system will save the
viewed report in a tab so you can go back to the report later. If you want to close the report click on the tab
and click on the X at the end of the tab description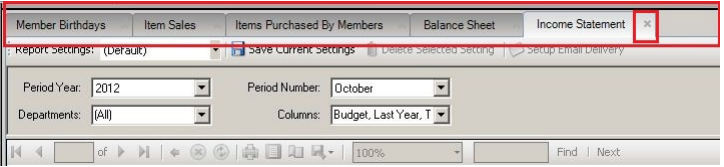
- Notes:
If you do not see Tabs at the top you are on an older version of Clubessential; email Clubessential support and request an upgrade
- Any Interactive Report you go into you will see the Tabs at the top
- The Tabs and the Report Settings will remain until you exit CMA or click the X at the end of the tab description
- Notes: