Versions Compared
Key
- This line was added.
- This line was removed.
- Formatting was changed.
Table of Contents
| Table of Contents | ||||||
|---|---|---|---|---|---|---|
|
Overview
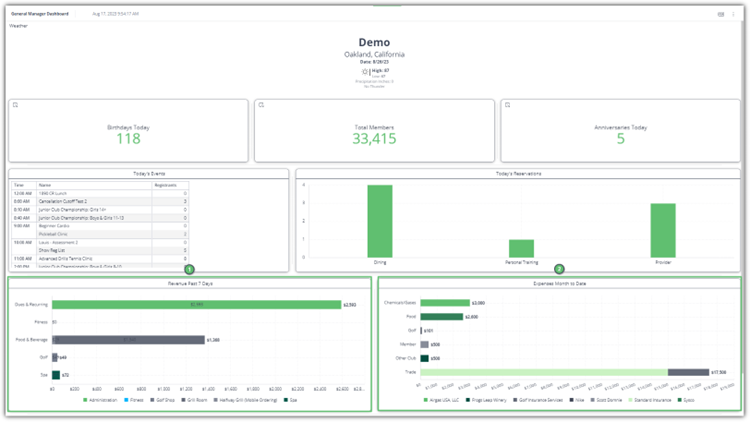
The GM Dashboard is the General Manager’s one stop shop to gauge performance and revenue for the club. You can see member information such as birthdays and member counts, as well as today’s events and registrations.
Each dashboard you access will be composed of various widgets. Some can be modified via filters but also will have options within the widget to drill down for more information and Data. For more information on filtering widgets, please refer to the guides:
Required Permissions
Club Intelligence Admin
Accessing the Tool
Go to Admin Bar.
Select Club Intelligence.
Select the GM Dashboard.
Member Dates
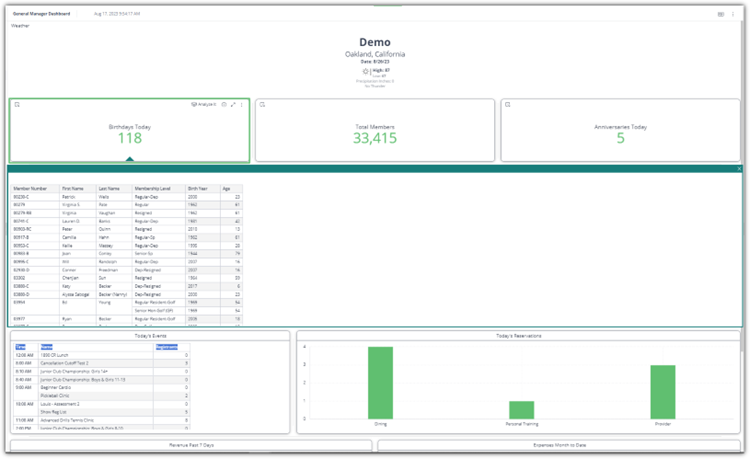
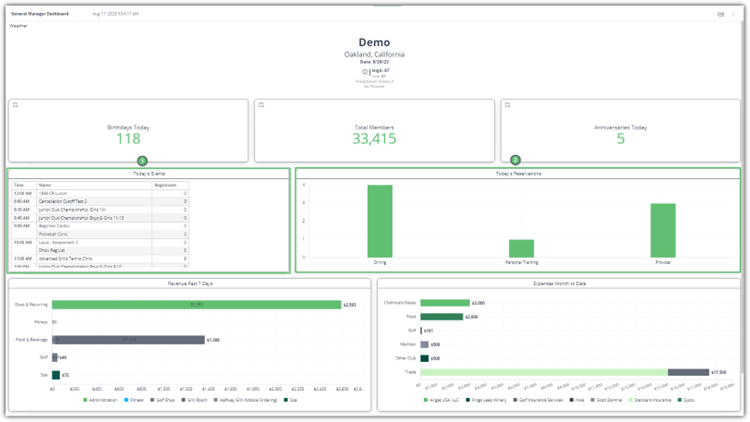
The first row of widgets will have member specific data:
Birthdays Today – Click on the Birthdays widget to produce a list of all the birthdays occurring today.
Total Members – Click on the Total Members widget to see a breakdown of the total members at the club. This widget will show a bar chart listing the member types and their Average Age & Tenure with the club.
You can switch between age and tenure by selecting the Average Age or Average Tenure boxes below the chart. Hover over a member type to see the numerical representation of the average age/tenure or both.
Beneath the age/tenure chart you will see a spreadsheet listing the member types and additional information about the members grouped by member type.
Member Level (Type)
First Name
Last Name
Birthday
Join Date
Age
Tenure
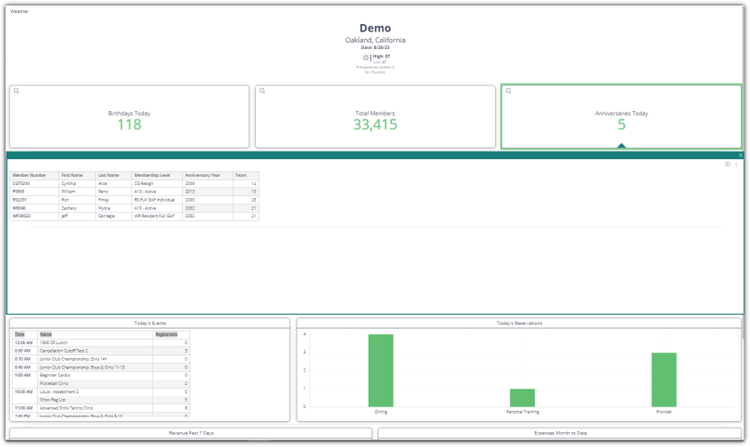
Anniversaries Today – Select the Club Anniversaries widget to see a list of all your members who have an anniversary with the club today. The report will show the user:
Member Number
First Name
Last Name
Membership Level (Type)
Anniversary Year
Total Years at the club.
Event Calendar and Reservations
The next set of Widgets will show the user:
Today’s Events – Any event linked to the Event Calendar will show in this widget. You can see the time of the event, the name, and how many registrants the event has as of the last sync.
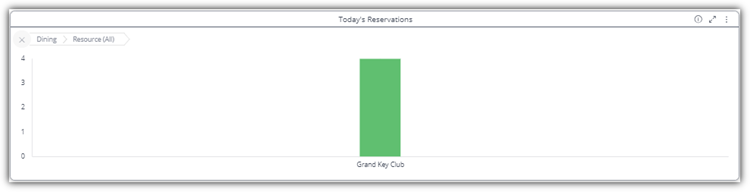
Today’s Reservations – Any and all Reservations for the website’s reservation system will be shown here in Bar graph format. It is Broken down by Location. Click on a location to drill down into resource to see multiple location breakdowns. i.e., different court locations.
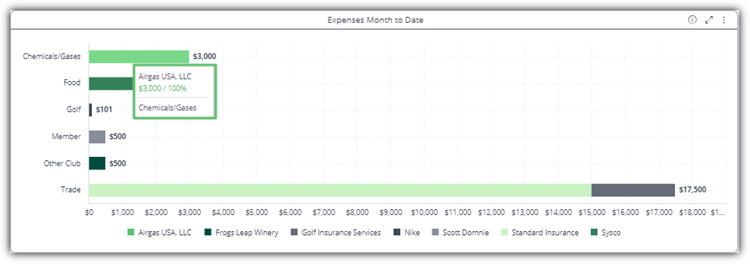
Revenue and Expenses
The final set of widgets will show:
Best Practices
FAQs
