CRM - Reporting & Dashboard
Overview
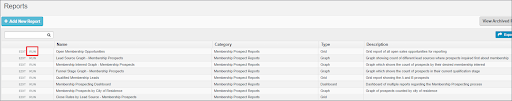
Within the CRM the reporting tool is a feature that provides club staff with insightful visuals and insights on prospect and member information. Some standard reports include New Members by Year, Average Age of Members by Membership Level, Members With No Email Address, Reservations by Membership Type, Reservations by Day of Week, Open Membership Opportunities, Funnel Stage Graph - Membership Prospects, and many more.
In addition to accessing the reports within the CRM, they can be exported for informational purposes like board meetings or other presentations.
Required Permissions
CRM Admin
Use Case(s)
To view information about the number of prospects in each stage of the pipeline.
To track member reservations activity.
To view member information by member level.
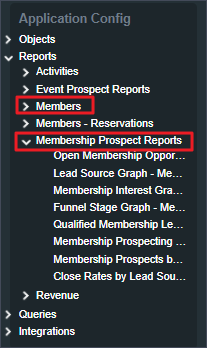
Accessing the Tool
Select the header of reports and not the specific report (if a specific report was selected here, the edit window will appear for that report)
While viewing the list of reports, select RUN to view
Dashboards
A CRM dashboard gives club staff a snapshot of the metrics that matter most to their job function. A dashboard provides a broad overview of things including, the prospect pipeline, hottest leads, member reservation activity, and more.
Three Standard Dashboards that come with your CRM system are the Membership Prospecting Dashboard, Reservations Dashboard, Event Opportunities Dashboard, each include a variety of reports to give you a snapshot of club operations.
To access your dashboards, you will find them on the left hand panel.
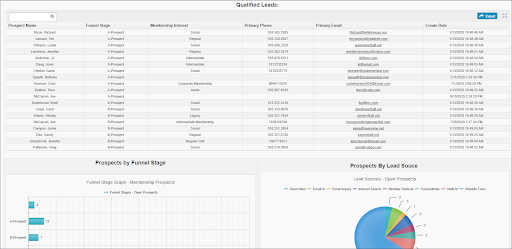
Some of the reports included in the Membership Prospecting Dashboard include:
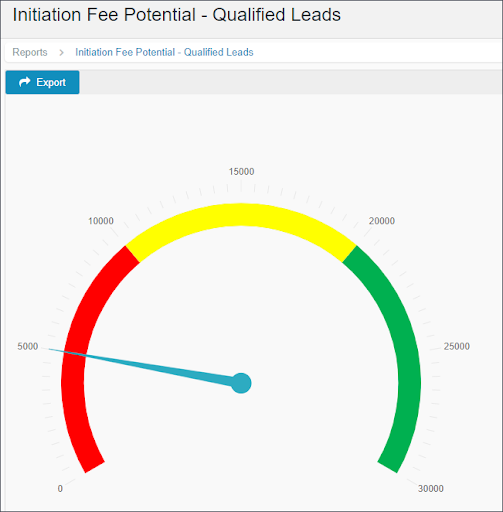
Qualified Leads - displays Membership Prospect records with a funnel stage of either A-Prospect or B-Prospect
Prospects by Funnel Stage, Lead Source, Membership Interest Graphs
Close rates by Lead Source
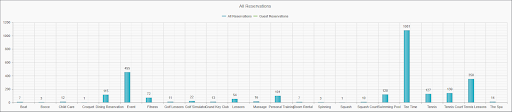
Some of the reports included in the Reservations Dashboard include:
Reservation Cancellations/No-Shows
Reservations by Member & Guest
Reservations by Member Type and Guest Type Graphs
Reservations by Day of Week and Hour of Da
Best Practices
Graph reports are the most commonly used. This allows you to display data in a bar, line, plot, or a number of graph types. Very useful for visualizing data easily
A gauge report will use your data to display a gauge that looks similar to a speedometer. This can be used to display data like event attendance or prospect interest